


Random Process
In this post I'll try to convince you that I am not insane for my enthusiasm for the idea of random process ( even though I was introduced to the idea today ) since this is modelling of data blew my mind on how visually rich it was.
The Example
We'll understand everything related to stochastic or random process by using this one example that is very intuitive and easy to imagine.
Suppose a car goes from a point A to another place point B.
We can measure the VELOCITY of the car with respect to distance
- So now we have a a graph of velocity at every point in the path
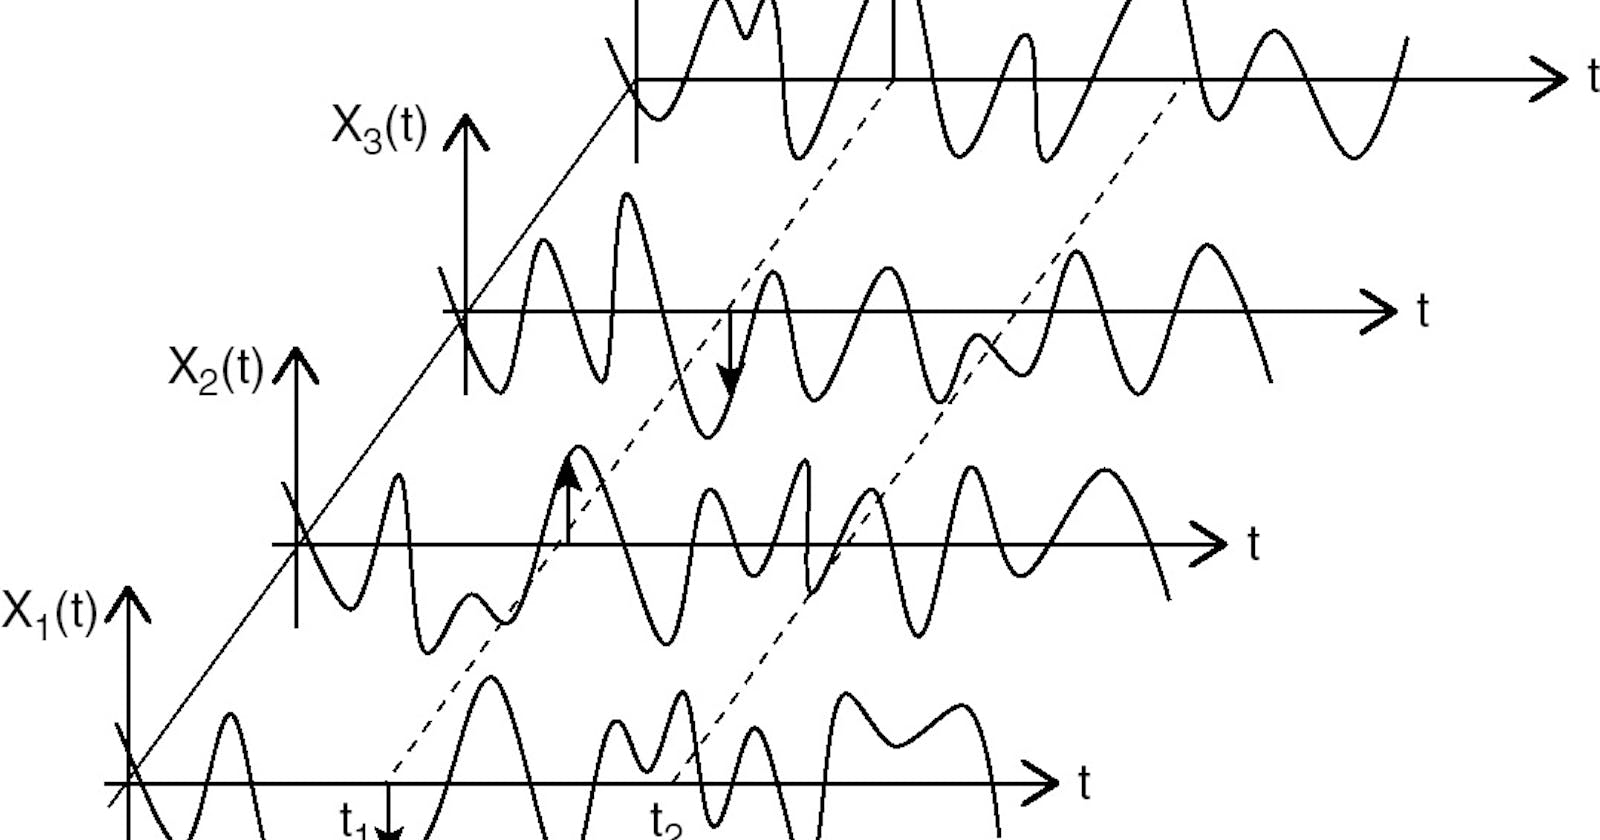
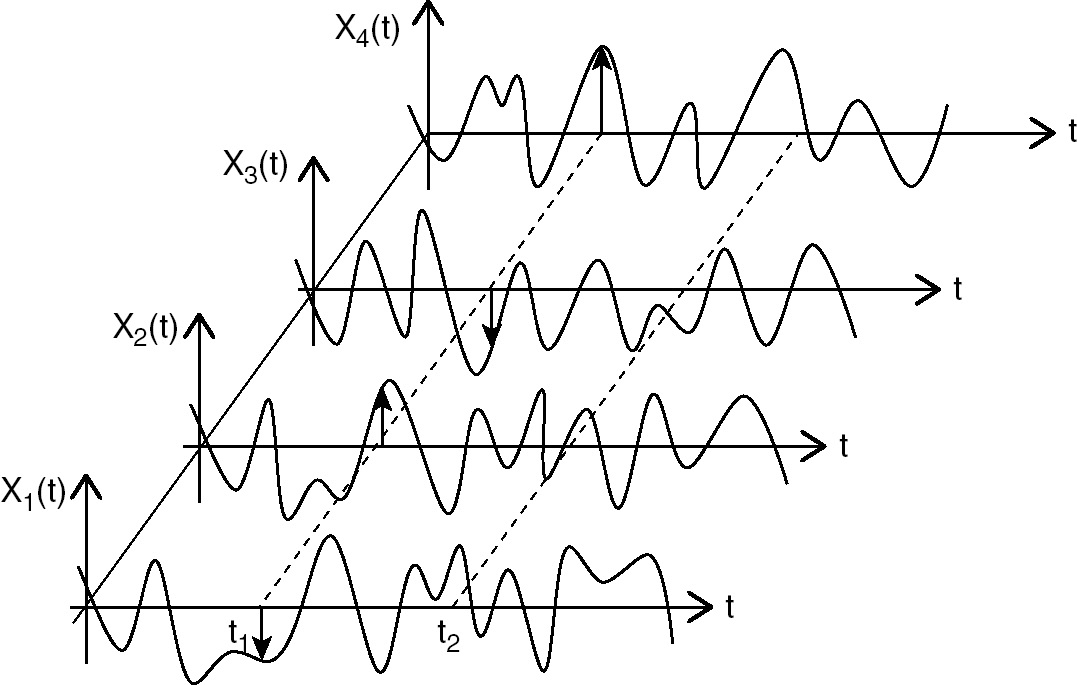
Suppose we record this EVERY DAY, so we have many TRIALS of the same experiment ( which is just car going from A to B )
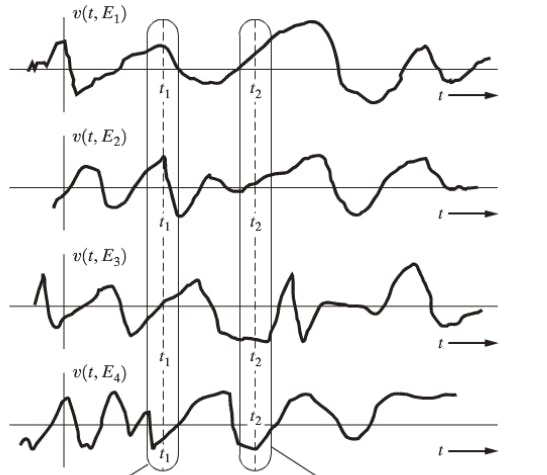
( Suppose instead of time, this graph was with respect to distance. Then we have 4 TRIALS of the experiment. Each experiment gives us a function, a continuum of numbers corresponding to each point in the path, i.e a function with respect to distance from the starting point. )
Important Intuition
If you compare all the graphs, you EXPECT certain patterns.
Between certain points ( like when your car is going across some SIMILAR SECTIONS of road, like crowded road ) you expect SIMILAR BEHAVIOUR across all the graphs.
You can see which all trials gave an anomalous ( unexpected ) behaviour across certain sections.
Average speed for each trial.
Definition
A random variable 𝑋 that is a function of time, i.e
𝑋(𝑡)is called a random processIndependent variable can be any deterministic argument
𝑧instead oftIn our example it was distance.
So how to visualize ?
Now for another important point :-
In our example,
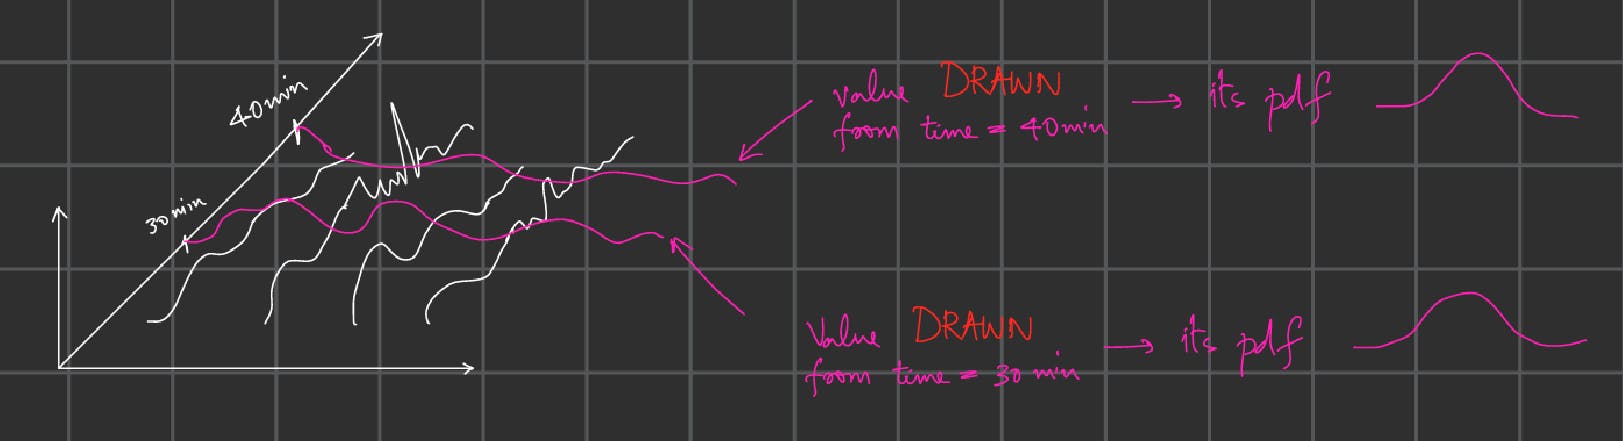
let's look at the velocity of the car
at a particular pointsay x = 10 m,across
all the trials, So now we have a many values of velocities corresponding to each trial.These are the sample points of velocity, USING WHICH we can construct a probability density function of velocity at the instant x = 10.
So for DIFFERENT point in the path, we can construct DIFFERENT probability density functions.
- So at a given time, 𝑡 = t ' , random process is reduced to a random variable.
And how to visualize this ?
Why does that matter ?
Given a random variable's probability density function, we can tell a great number of things.
what is the value of at which X is most likely to occur ( Mean )
what dispersed are the probable values ( Variance )
How likely is the probable X ( Peakness )
Is the function leaning to one side than the other ( Skewness )
Is there any symmetricity to left and right side of the peaks ( Kurtosis degree )
Mathematically, there is something called a moment and different orders of moment give us different class of characteristics that a density function possess. So mean was from the first order moment, variance was from second, and so on. But it is enough to understand that we can say a great deal of things about a experiment JUST from the density function and by employing some mathematical wizardry.
But what does that look like ?
![5.3 INDICATOR RANDOM VARIABLE - Probability, Random Variables, and Random Processes: Theory and Signal Processing Applications [Book]](https://www.oreilly.com/api/v2/epubs/9781118393956/files/OEBPS/images/nc05f001.jpg)
in this x-axis is supposed to be velocity, y axis is the probability so it's closed between 0 and 1
- so for EVERY SINGLE point in the path, we can construct such density functions.
So this opens up a whole new lines of thought -
We can quantify how likely are the velocities going to be across sections of the road.
How quickly are the mean or ANY CHARACTERISTIC of each pdf corresponding to each point CHANGING ?
- is the spread of probable velocities increasing faster ?
Is one pdf at a point in any way similar or related to pdf at some other point.
Important Inferences from Random Process
Different order of moments gave insight into different class of characteristics of random variable's probability density function, as said before
Different orders of moments give classes of characteristics for a Random Process too.
Important techniques to quantify these characteristics are : -
Auto-correlation
Auto-covariance
Cross-covariance
Invariance to time shift in pdf
Ergodicity